About WebPlan
WebPlan is an online platform for PDDL planning problems and reference solutions. WebPlan provides an API for submitting and accessing problems, corresponding solutions and associated meta data. Uploaded solutions are evaluated for correctness using VAL. The best known solution and its costs is stored for every problem.
Problems
A PDDL planning tasks consists of a domain and a problem file. The domain file is the general description of a specific class of planning problems, defining predicates and actions. That could be for example the general rules of the puzzle game Sokoban. The problem file describes an instance of a specific problem, defining objects and initial and goal states. For Sokoban that could be the board size size, number of boxes, and so an. Both, the domain and problem file are needed to solve the planning task.
For benchmarking purposes, one usually runs a planner on numerous, differently hard problems of the same domain. Depending on the problem and PDDL language features used, it can be necessary to use a separate domain file for every problem instance, due to limitations of the PDDL language subset used. In WebPlan the complete description of a PDDL planning task (domain and problem file) is called a problem. A problem is identified by a hash, that is computed from the problem and domain PDDL files. The hash does not take comments, whitespace and the PDDL requirement specification into account. But it is not invariant to any other changes in the PDDL domain or problem definitions, not even trivial ones. E.g. if you rename an object from player to player_ that’ll yield a different hash.
Tags
In WebPlan, tags are used to define sets of problems. A tag consists of a type and name. Tags of some types are automatically attached to problems when uploaded, e.g. tags of type pddl_requirement, describing the PDDL language features used. Despite of this speciality, WebPlan does not provide any semantic interpretation of tags. It’s up to the user to define tags that he considers useful.
Tags can be attached to problems, whereas the relation of the tag to the problem can hold an optional property number. Let’s assume you’ve attached a tag of type domain and name sokoban to a set of 10 problems. In this setting, the easiest problem could have number 1, whereas the hardest could have number 10 attached.
In the following, we use the notation “type,name[,number]” for tags, e.g. “domain,sokoban,1”.
Best known Solution
WebPlan maintains a reference database of the currently best known plans for every problem. This database is update every time every time a better plan is submitted, together with all dependent result scores.
Equivalences
Sometimes there exist multiple, equivalently hard (in terms of planning costs of the optimal plan) formulations of the same planning problem, using different PDDL language features for example. WebPlan provides a set of equivalently hard problems for every problem, defining an equivalence relation. The equivalence relation can be accessed and modified using WebPlans REST API. It does not have any semantic interpretation by at the moment. It is in particular not taken into account by WebPlans integrated report viewer nor score computation.
Results
Plans can be submitted for any problem in the WebPlan database. For submitting a plan, the hash of the problem that is solved and a name of the planner has to be given. The Problem hash can be calculated using WebPlans python library. It’s up to the user to choose an appropriate planner name.
A Plan belongs to exactly one named set of results, called upload. The upload has to be created upfront. The set of plans contained in an upload can be modified unless an upload has been finalized, effectively protecting it from any further changes.
A Plan is only accepted if it is considered valid by VAL. The IPC-Score (best_costs/costs) is calculated for submitted plans and can accessed using the API or viewed using the integrated report viewer.
Reports
WebPlan provides a basic report viewer for evaluation of submitted plans. It displays results for problems with given tags in a table, grouped by any tag type (e.g. domain). The results shown can be narrowed down to a given set of uploads.
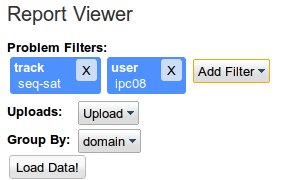
The following screen shot you can see the tag filter set to track,seq-sat and user,ipc08. All problems that have both tags when you click on Load Data.
You can further narrow the shown data by selecting a subset of planners/rows. Either remove individual planners/rows using the red delete button or select what you’re interested in in the drop down menus. This is what it’ll look like:
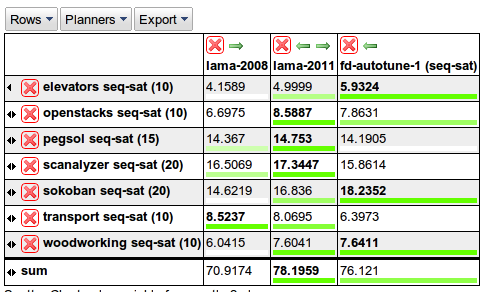
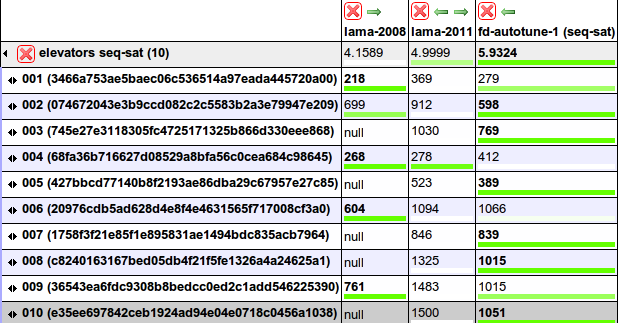
Best values are printed in bold. The green bar gives an optical impression of how good a value is compared to the other values in the row. Greener means better. Columns can be reordered with the green arrows in the heading row or sorted by clicking on the sort buttons leftmost in each row. In the example above, they where sorted in ascending order by score in elevators. Please note that the browser URL changes dynamically as you change the table. The URL can be copied and used later to access the view you configured. Rows can be expanded to see the values for individual problems:
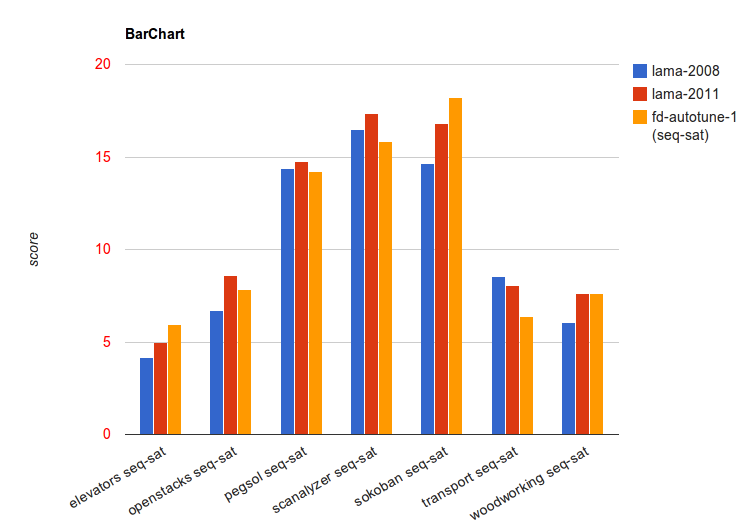
In addition to visualization in the table, the grouped scores are also visualized in a bar chart under the table. The bar chart is updated as you change rows and cols in the table:
If exactly two planners are selected, there’s an additional scatter plot drawn:
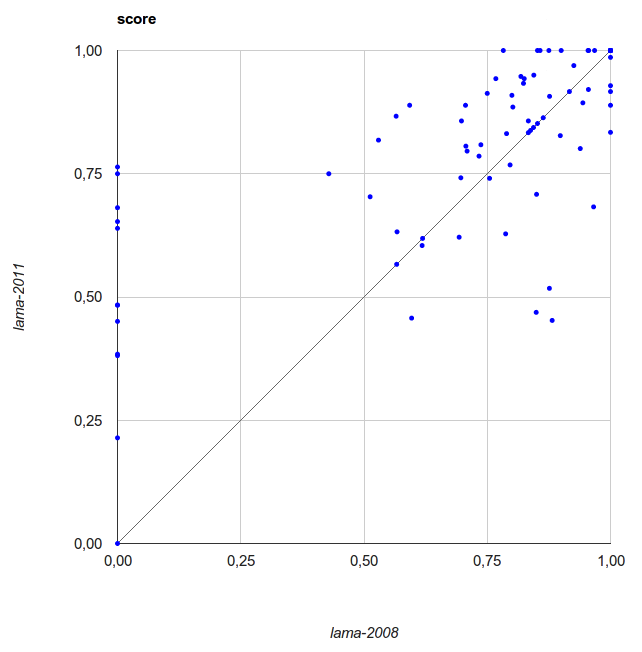
Please note that the scatter plot contains values for all problems included in the current table, as opposed to the bar chart which uses the grouped values. This is why the range in the scatter plot above is different.
Tables can be exported as latex tabular environment. You can choose to export the grouped table or a detailed table for a specific group (e.g. all problems in elevators). Charts can currently not be exported.
More detailed information about a problem is revealed by clicking in the table. This includes all tags attached to the problem, its history of best costs (cost revisions) and all plans submitted.
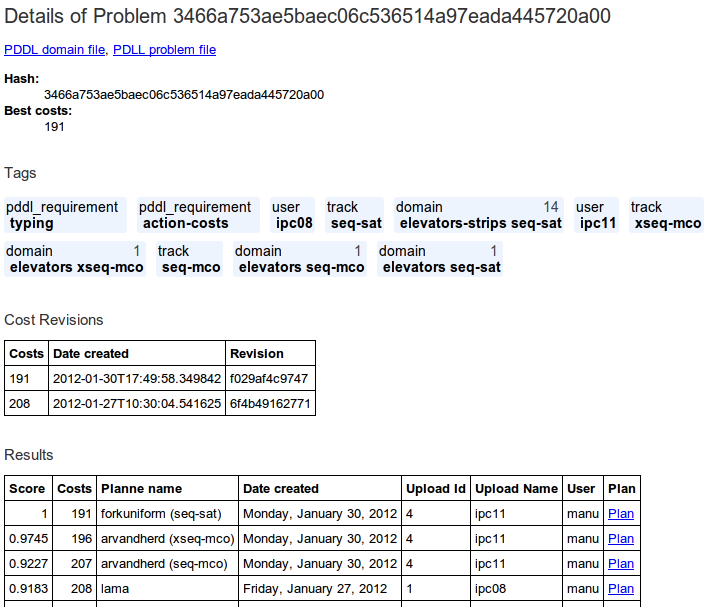
Individual cells are also clickable to display all results submitted for this problem and planner (only the best one is shown in the table).
High Score
Webplan features an high score view that shows the best score achieved for all tags. Best means the greatest sum of scores for all problems with this tag achieved by a single planner. All planners that achieved the best score for a tag are listed too. This is how it looks like:
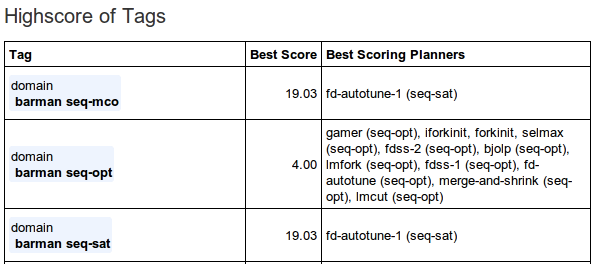
Clicking on a tag shows an high score table for all problems with this tag.
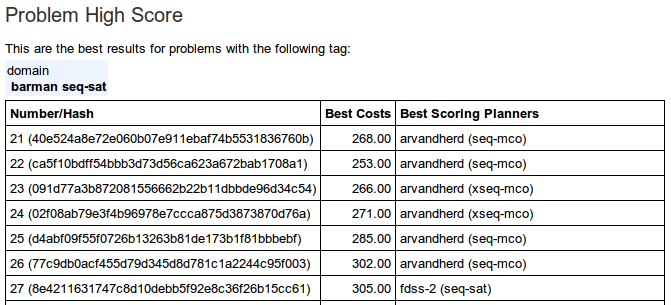
Please note that the planners that score high for individual problems do not necessarily have to be the same that score high for the whole tag.